 Image from Wikimedia Commons
Working with Missing Values in Pandas
19 Feb 2018Table of Contents
Here we’ll see how to work with missing values in a Pandas DataFrame on a data set from the World Bank Open Data of the Global Economic Monitor.
Load and Prepare Data
import pandas as pd

path = 'data/GemDataEXTR/Emerging Market Bond Index (JPM Total Return Index).xlsx'
df = pd.read_excel(path, sheetname='annual')

# Drop first row
df = df.iloc[1:]

# Convert index column to integer
df.index = df.index.map(int)
df.head(12)
| Argentina | Bulgaria | Belarus | Belize | Brazil | Chile | China | Cote d'Ivoire | Colombia | Developing Countries | ... | El Salvador | Serbia | Trinidad and Tobago | Tunisia | Turkey | Ukraine | Uruguay | Venezuela, RB | Vietnam | South Africa | |
|---|---|---|---|---|---|---|---|---|---|---|---|---|---|---|---|---|---|---|---|---|---|
| 1990 | NaN | NaN | NaN | NaN | NaN | NaN | NaN | NaN | NaN | NaN | ... | NaN | NaN | NaN | NaN | NaN | NaN | NaN | NaN | NaN | NaN |
| 1991 | NaN | NaN | NaN | NaN | NaN | NaN | NaN | NaN | NaN | NaN | ... | NaN | NaN | NaN | NaN | NaN | NaN | NaN | NaN | NaN | NaN |
| 1992 | NaN | NaN | NaN | NaN | NaN | NaN | NaN | NaN | NaN | NaN | ... | NaN | NaN | NaN | NaN | NaN | NaN | NaN | NaN | NaN | NaN |
| 1993 | NaN | NaN | NaN | NaN | NaN | NaN | NaN | NaN | NaN | NaN | ... | NaN | NaN | NaN | NaN | NaN | NaN | NaN | NaN | NaN | NaN |
| 1994 | NaN | NaN | NaN | NaN | NaN | NaN | NaN | NaN | NaN | NaN | ... | NaN | NaN | NaN | NaN | NaN | NaN | NaN | NaN | NaN | NaN |
| 1995 | 82.61642 | 120.3042 | NaN | NaN | 90.6030 | NaN | NaN | NaN | 79.44512 | NaN | ... | NaN | NaN | NaN | NaN | NaN | NaN | NaN | 80.24534 | NaN | NaN |
| 1996 | 111.72060 | 156.6395 | NaN | NaN | 126.5848 | NaN | NaN | NaN | 95.76585 | NaN | ... | NaN | NaN | NaN | NaN | NaN | NaN | NaN | 126.69840 | NaN | NaN |
| 1997 | 140.11080 | 249.7464 | NaN | NaN | 158.6840 | NaN | NaN | NaN | 111.81540 | NaN | ... | NaN | NaN | NaN | NaN | NaN | NaN | NaN | 172.71890 | NaN | NaN |
| 1998 | 147.66550 | 281.3943 | NaN | NaN | 155.3104 | NaN | NaN | NaN | 133.09940 | NaN | ... | NaN | NaN | NaN | NaN | NaN | NaN | NaN | 161.67040 | NaN | NaN |
| 1999 | 154.43290 | 305.8159 | NaN | NaN | 158.3479 | NaN | NaN | NaN | 164.19570 | NaN | ... | NaN | NaN | NaN | NaN | 138.8067 | NaN | NaN | 173.32320 | NaN | NaN |
| 2000 | 174.57410 | 370.4026 | NaN | NaN | 202.6921 | NaN | NaN | NaN | 188.40200 | NaN | ... | NaN | NaN | NaN | NaN | 152.3002 | NaN | NaN | 211.69040 | NaN | NaN |
| 2001 | 152.42480 | 410.3846 | NaN | NaN | 218.9289 | NaN | NaN | NaN | 213.20560 | NaN | ... | NaN | NaN | NaN | NaN | 149.6182 | 180.0858 | NaN | 242.96080 | NaN | NaN |
12 rows × 49 columns
As you can see the data set is filled with quite a few NaN values. In order for us to work properly with the data set we will drop all rows where all values missing by using the pandas.DataFrame.dropna function.
df.dropna(axis=0, how='all', inplace=True)
We can check with Pandas how many values are still null by summing over result of the pandas.isnull function. For the summing we use pandas.DataFrame.sum function to sum over an axis (by default axis 0) which returns us a pandas.Series. Note that in the sum all True values are viewed as 1 and all False values as 0. Now we can see the first 10 countries with their number of missing values.
df.isnull().sum()[:10]
Argentina                0
Bulgaria                 4
Belarus                 19
Belize                  18
Brazil                   0
Chile                   18
China                   18
Cote d'Ivoire           18
Colombia                 0
Developing Countries    18
dtype: int64
This function is also a great way to get a quick overview in which columns are missing values hidden.
Say, we want to get all the countries that have no missing values. We get those by first getting the Series with the number of each of the missing values from before and then applying a condition with the pandas.Series.where function followerd by dropping all the resulting countries which are NaN. Another way is to filter the Series is by using boolean variables s == 0 which evaluates the whole Series if each value is equals to zero by a boolean value. This boolean Series can be then in turn used to filter the Series by applying s[s == 0] which does the same thing as the previous example.
s = df.isnull().sum()
countries = s.where(s == 0).dropna(how='any') # eqivalent
countries = s[s == 0]                         # eqivalent
Visualize Data
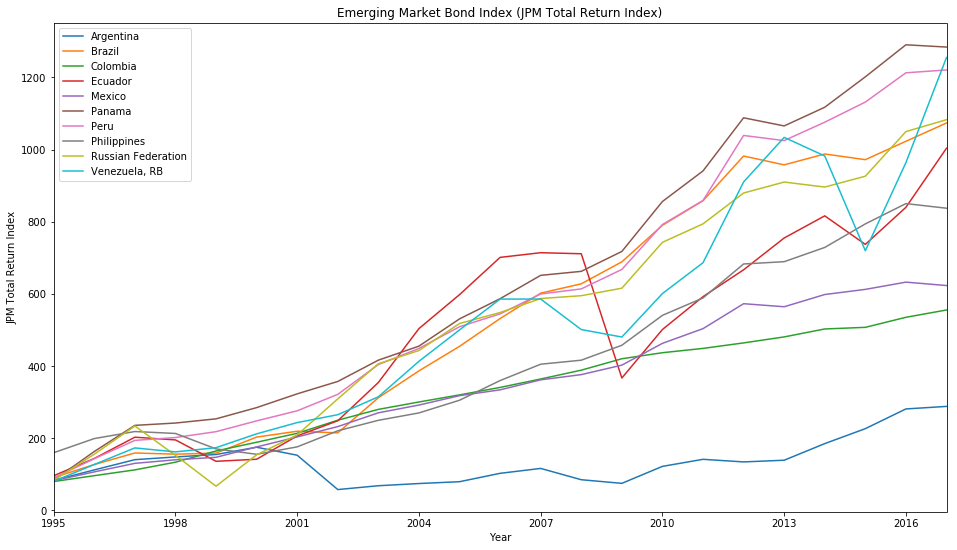
Finally we will plot part of the data set with the pandas.DataFrame.plot function and we will compare the Emerging Market Bond Index (JPM Total Return Index) for all countries that have no missing values in the data set. We do that by filtering this time the DataFrame by the columns with the country names that we extracted perviously.
%matplotlib inline
import matplotlib

# Specify figure size
matplotlib.rcParams['figure.figsize'] = (16, 9)

ax = df[countries.index].plot(title='Emerging Market Bond Index (JPM Total Return Index)');
ax.set_xlabel('Year');
ax.set_ylabel('JPM Total Return Index');

# Force integer labels for x-axis
ax.xaxis.set_major_locator(matplotlib.ticker.MaxNLocator(integer=True));